Choosing the right chart for your data is essential or you won’t be able to effectively convey your message to the relevant audience. An unclear graphic chart in particular can confuse decision-makers and hinder rather than aid a good decision.
Microsoft Excel offers various types of graphic charts for data presentation, such as bar, line, pie, scatter plot charts, etc. Since there are many types of charts available, it is important to know each one in detail.
Bar Chart in Excel
The most popular type of chart that displays various types of raw data very easily and effectively.
In bar charts, the length of the bar is used to represent value. If the value of a commodity is high, the length of the bar will be longer, and if the value is low, it will be correspondingly shorter.
As a very simple example, in the month of March, Product A sold 300 and Product B sold 100.
In a bar chart, the data described above will appear as follows:
Discrete Data: Bar charts are a great option for comparing discrete categories or groups. (like product names, regions, or survey options).
Comparing Categories: Very useful for seeing comparisons between multiple categories. Bar charts are a great choice for comparing sales data for different products, website traffic from different sources, or survey responses to different questions.
Bar charts example: A bar chart would clearly show the sales figures for each product, allowing for quick comparison.
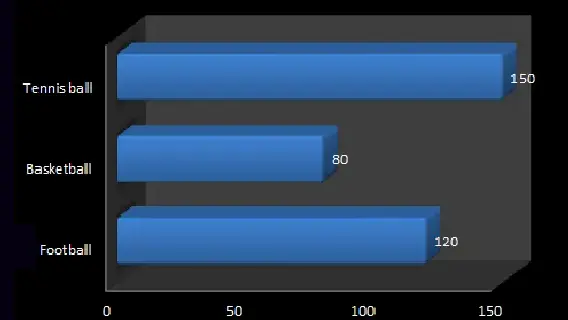
Example 1: Product sales comparison of different types of sports balls.
Product
Sales (in units)
Football
120
Basketball
80
Tennis ball
150
The percentage of online traffic originating from each source can be successfully displayed using a bar chart. Data example is as below
Organic Search
50%
Paid Ads
20%
Social Media
15%
Referrals
10%
Direct Traffice
5%
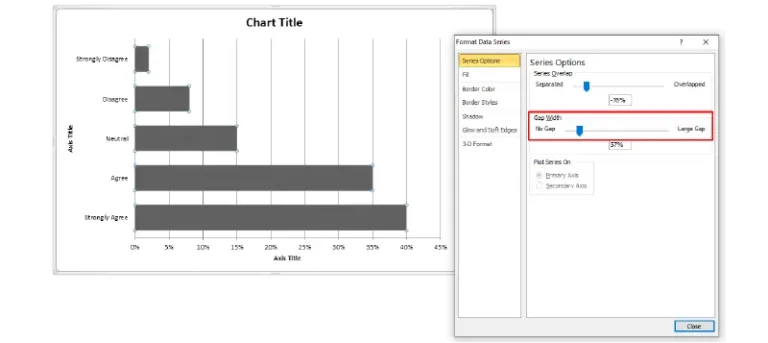
An additional illustration of a horizontal bar chart that simplifies the display of the proportion of respondents for each perspective.
There are a few more sophisticated chart choices. Here is a short summary of them. Bar charts that are grouped: These are useful for comparing several categories within several groups. (For instance, offering distinct goods in several geographical areas.)
Stacked Bar Charts: These are useful to display each category’s makeup. (For instance, a breakdown of costs by department.)
Some important suggestions to maintain the efficiency of bar charts.
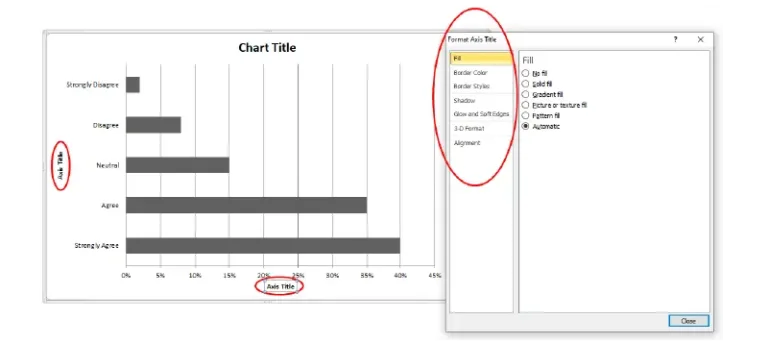
Axis Options:
The bar axis should clearly display the category name and units of measurement.
Excel has “Axis Options.” You can adjust bounds, units, vertical axis crosses, display units, tick marks, labels, and numbers as per your need. There are also options to choose colors, effects, sizes, and attributes.
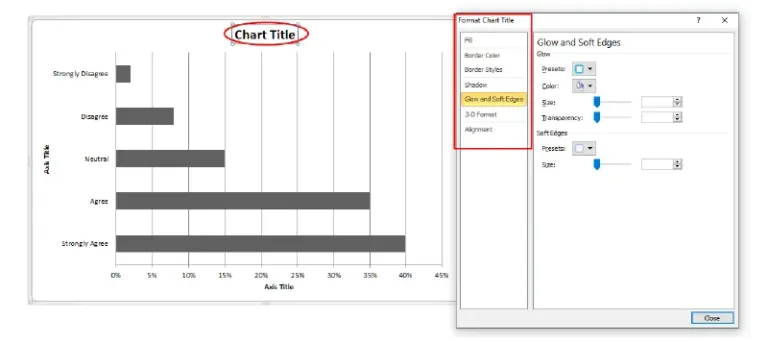
Chart title.
A short, concise, relevant, and descriptive chart title can grab the viewer’s attention. Excel offers title options to adjust the chart’s title, such as color, effect, size, and properties. Moreover, you also have title text options, using which you can edit text effects, text fill, and outline.
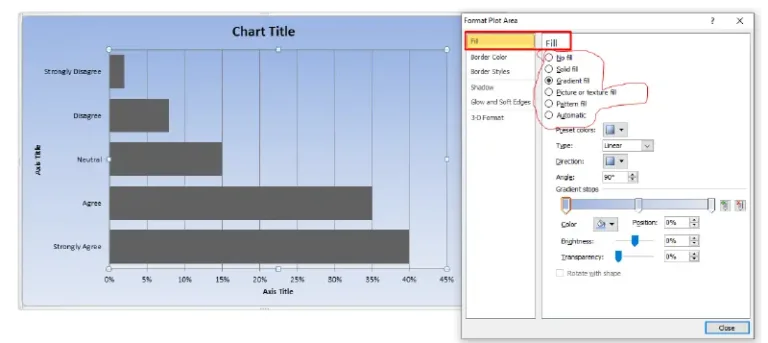
Color Selection:
Color selection requires a lot of care. Colors should be chosen strategically with your audience in mind.
A single color is often sufficient for simple comparisons, but judicious use of different colors to highlight specific categories or groups should help your chart capture the viewer’s attention and serve the purpose.
Excel offers color options for almost every element of the chart, like you can select or change the color of the chart area, plot area, axis, title, label, table, bars, grid lines, etc. as per your wish.
Bar Width:
By default, you get the width of the bar in Excel. Either way, you can change the width of the bars but make sure that the bars should be wide enough to be easily seen but not so wide that it looks cluttered.
It is better to be aware
It is important to consider when and how to use bar charts effectively. If you can’t communicate your data clearly, you won’t be able to influence your audience.
When choosing a chart type, it’s important to consider your data, your message, and your audience, or your efforts will be futile.
Bar charts are not a good option for continuous data because values can fall anywhere on a scale (such as temperature or altitude).
Relatively few categories: Using bar charts with many categories is not a suitable method as it becomes cluttered and difficult to read. If a large number of categories are needed, the characteristics of the data can be better presented using a horizontal bar chart or other visual method.
Conclusion
There is no doubt that Excel charts not only provide tools to present data in an impressive manner but also allow you to modify them as per your wish and need, making it relatively easy for decision makers to make accurate and timely decisions.